
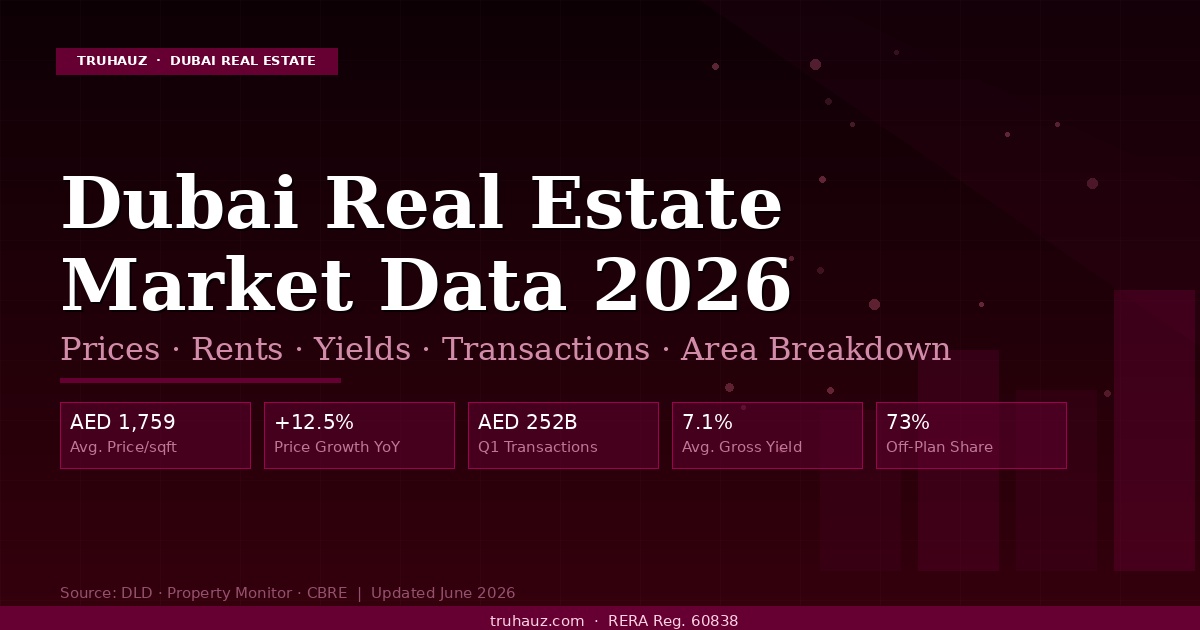
Dubai Emlak Piyasası Raporu
Ağustos 2026
İşlem hacimleri Temmuz'dan sonra geriledi, sq ft başına fiyat neredeyse hiç değişmedi ve yıllık karşılaştırma belirgin şekilde negatif kaldı. Aşağıdaki her rakam, adı belirtilen bir kaynağa ve yayım tarihine dayandırılmıştır — kaynağını bulamadığımız ve tahmin etmek yerine dışarıda bıraktığımız rakamlar dahil.
Ağustos 2026'da Gerçekte Ne Oldu
Ağustos 2026, aylık hacimlerde iki aydır süren ve Temmuz raporumuzda bildirdiğimiz iyileşme serisini bozdu. Konut satışları geriledi, off-plan ve hazır stok birlikte düştü ve yıllık karşılaştırma derin şekilde negatif kaldı. Olmayan şey ise çoğu okurun bu manşetlerden varsaydığı şeydi: fiyatlar neredeyse hiç değişmedi.
Hacim tarafında, Projectory Research, Ağustos 2026'da AED 21.43 milyar değerinde 11,147 konut satışı saydı; bu, Temmuz'a göre .5'lik bir düşüş demek; veriler, 1 Eylül 2026'da yayımlanan bir Dubai Land Department verisi analizinden. Off-plan tescilleri aylık %10.8, hazır konut satışları ise %13.6 düştü. Piyasanın her iki yarısı da kabaca benzer bir hızla yumuşadı ve bu not edilmeye değer: bu, segmentler arasında bir rotasyon değil, genel olarak daha sakin bir aydı.
Fiyat tarafında aynı kaynak sq ft başına medyan fiyatı Temmuz'daki AED 1,680'e karşılık AED 1,693 olarak belirledi — yüzde birin çok altında bir hareket. Buna karşılık medyan satış fiyatı AED 1.06 milyondan AED 1.16 milyona yükseldi. Bu iki rakamın farklı hızlarda hareket etmesi, Dubai'nin sq ft başına daha pahalı hale geldiğini değil, satış karmasının daha büyük ünitelere kaydığını gösterir.
Dubai Piyasa Özeti — Ağustos 2026
Aşağıdaki tablodaki her rakamın kaynağı belirtilmiştir
Ağustos 2026 Temel Göstergeler
Dubai'nin aylık verileri, Dubai Land Department kayıtlarından çalışan birkaç kuruluş tarafından yayımlanır ve hepsi aynı sepeti saymaz. İki kaynak benzer bir metriği farklı bildirdiğinde, ikisi de tek bir sayıda ortalaması alınmak yerine kapsamlarıyla birlikte gösterilir.
| Gösterge | Ağustos 2026 | Değişim | Kapsam | Kaynak ve Tarih |
|---|---|---|---|---|
| Tüm işlem türleri | AED 46.22B / 15,960 | — | Satışlar, ipotekler ve hibeler | DLD, Voice of Emirates aracılığıyla, 1 Eyl 2026 |
| Satışlar | AED 27.89B / 11,600 | — | Tüm varlık sınıfları | DLD, Voice of Emirates aracılığıyla, 1 Eyl 2026 |
| İpotekler | AED 14.36B / 3,735 | — | Tüm varlık sınıfları | DLD, Voice of Emirates aracılığıyla, 1 Eyl 2026 |
| Hibeler | AED 3.97B / 620 | — | Tüm varlık sınıfları | DLD, Voice of Emirates aracılığıyla, 1 Eyl 2026 |
| Konut satışları | 11,147 / AED 21.43B | −.5 aylık | Yalnızca konut | DLD verileri üzerine Projectory Research, 1 Eyl 2026 |
| Off-plan konut satışları | 8,270 — toplamın .2'si | −.8 aylık | Yalnızca konut | DLD verileri üzerine Projectory Research, 1 Eyl 2026 |
| Hazır konut satışları | 2,877 — toplamın .8'i | −.6 aylık | Yalnızca konut | DLD verileri üzerine Projectory Research, 1 Eyl 2026 |
| Medyan satış fiyatı | AED 1.16 milyon | Temmuz'daki AED 1.06M'den yükseldi | Yalnızca konut | DLD verileri üzerine Projectory Research, 1 Eyl 2026 |
| Medyan sq ft başına fiyat | AED 1,693 | +%0.8 aylık −%1.9 yıllık | Yalnızca konut | DLD verileri üzerine Projectory Research, 1 Eyl 2026 |
| Satış hacmi, yıllık | — | −.2 yıllık | Yalnızca konut | DLD verileri üzerine Projectory Research, 1 Eyl 2026 |
| Tescilli değer, yıllık | — | −.5 yıllık | Yalnızca konut | DLD verileri üzerine Projectory Research, 1 Eyl 2026 |
| Off-plan ve hazır, yıllık | — | Off-plan −.7 / hazır −.5 yıllık | Yalnızca konut | DLD verileri üzerine Projectory Research, 1 Eyl 2026 |
| Lider bölge | Dubai South — 2,079 satış / AED 2.65B | — | Yalnızca konut | DLD verileri üzerine Projectory Research, 1 Eyl 2026 |
| Lider tekil proje | Azizi Venice — 1,503 satış | Tüm Ağustos satışlarının .5'i | Yalnızca konut | DLD verileri üzerine Projectory Research, 1 Eyl 2026 |
| Oca–Ağu 2026, tüm türler | AED 523.44B / 148,564 | 2025 yılının tamamının ≈.96'sı | Satışlar, ipotekler ve hibeler | DLD, Voice of Emirates aracılığıyla, 1 Eyl 2026 |
| Oca–Ağu 2026 satışları | AED 349.83B / 112,020 | — | Tüm varlık sınıfları | DLD, Voice of Emirates aracılığıyla, 1 Eyl 2026 |
| Oca–Ağu off-plan | AED 169.77B / 76,650 | — | Tüm varlık sınıfları | DLD, Voice of Emirates aracılığıyla, 1 Eyl 2026 |
| Oca–Ağu hazır stok | AED 180.05B / 35,370 | — | Tüm varlık sınıfları | DLD, Voice of Emirates aracılığıyla, 1 Eyl 2026 |
| Oca–Ağu ipotekler | AED 134.34B / 30,645 | — | Tüm varlık sınıfları | DLD, Voice of Emirates aracılığıyla, 1 Eyl 2026 |
| 2026 2. çeyrek konut | 34,850 / AED 84.9B | Yıllık hacim −, değer − | Konut, çeyreklik bağlam | Betterhomes piyasa raporu, 20 Tem 2026 |
| 2026 2. çeyrek prime AED 15M+ | 578 işlem | − yıllık; off-plan lüks + | Konut, çeyreklik bağlam | Betterhomes piyasa raporu, 20 Tem 2026 |
Kaynaklara 4 Eylül 2026'da erişildi: Voice of Emirates tarafından yayımlanan Dubai Land Department işlem rakamları, 1 Eylül 2026; Projectory Research'ün Dubai Land Department verileri analizi, 1 Eylül 2026; Betterhomes Dubai 2026 2. çeyrek konut piyasası raporu, yayım 20 Temmuz 2026. Kapsamlar farklı olduğundan farklı kaynaklardan gelen rakamlar satırlar arasında toplanamaz. Ağustos 2026 için adı belirtilen bir kaynaktan ValuStrat Fiyat Endeksi değerini, bölge düzeyinde yıllık fiyat tablosunu veya şehir geneli kira rakamlarını alamadık; bu nedenle bu raporda hiçbiri yer almıyor.
Ağustos 2026'yı Tanımlayan Altı Rakam
Bunların her biri yukarıda adı geçen kaynaklardan gelir. Bir noktayı açıklamak için yayımlanmış bir rakamı diğerine böldüğümüz yerlerde kart bunu belirtir ve girdileri gösterir.
Ayın en önemli rakamı. Tescilli değerde yıllık .5'lik düşüşe karşılık, aynı on iki ayda bir sq ft'nin fiyatı %1.9 düştü. Hacim hareket etti; fiyatlar etmedi.
Off-plan, ay bazında .8 düşmesine rağmen işlem hacminin yaklaşık dörtte üçünü korudu. Hazır stok .8 pay aldı ve biraz daha hızlı, .6 düştü.
Tek bir proje, Ağustos ayında Dubai'de tescil edilen yaklaşık her yedi konut satışından birini oluşturdu. Böyle bir ayda bölge düzeyindeki sıralamalar, temel talep kadar lansman takvimlerini de yansıtır.
İşlem sayısına göre lider bölge. Örnek: Ay için kaydedilen 11,147 konut satışının 2,079'u, şehir geneli hacmin yaklaşık .7'sidir — bu payı yayımlanmış iki rakamdan biz hesapladık.
Örnek: Tüm işlem türlerinde kaydedilen AED 46.22 milyarın AED 14.36 milyarı, Ağustos ayının toplam tescilli değerinin yaklaşık 'idir. Kredi faaliyeti, satış hacmini aynı oranda takip ederek düşmedi.
Aynı kaynağın karşılaştırmasına göre 2025 yılının tamamında kaydedilen AED 919 milyarın yaklaşık .96'sına eşittir. Örnek: bu hızla yıl, yıllıklandırıldığında AED 785 milyar civarına ulaşır (523.44 ÷ 8 × 12); bu da 2025'in yaklaşık altıdır.
Bu verilerin belirli bir mülke nasıl uygulanacağını mı merak ediyorsunuz?
Şehir geneli bir medyan bir üniteyi fiyatlamaz. Bize bölgeyi ve bütçeyi söyleyin — Ağustos verilerinin o varlık için ne anlama geldiğini söyleyelim.
Ağustos 2026'yı Doğru Okumak
Ağustos rakamlarının söylediği ve manşetteki yüzdelerin gizlediği üç şey.
Alıcılar daha pahalı değil, daha büyük aldı
Medyan satış fiyatı AED 1.06 milyondan AED 1.16 milyona yükselirken sq ft başına medyan fiyat AED 1,680'den AED 1,693'e çıktı. Örnek: bu iki hareketi birbirine bölmek, Ağustos'ta satılan medyan ünitenin Temmuz'dakinden %9 daha pahalı değil, kabaca %8–9 daha büyük olduğunu gösterir. Yalnızca medyan satış fiyatına dayanan manşetler bunu fiyat artışı olarak okuyacaktır. Oysa bu, piyasadaki ürünlerde bir değişimdir.
Tek bir proje bölge tablosunu değiştirdi
Azizi Venice 1,503 satış tescil ettirdi; kaynak bunu o ay Dubai'deki tüm konut satışlarının .5'i olarak belirtiyor ve proje, 2,079 satışla lider bölge olan Dubai South içinde yer alıyor. Bu tek projeyi çıkarırsanız bölge sıralaması belirgin şekilde farklı görünür. Dubai'deki aylık bölge sıralamaları, mahalle talebini olduğu kadar büyük off-plan lansmanlarındaki tescil zamanlamasını da yansıtır.
Değeri hâlâ hazır stok taşıyor
Ocak–Ağustos 2026 döneminde hazır stok 35,370 işlemden AED 180.05 milyar satış değeri üretirken, 76,650 off-plan işlemden AED 169.77 milyar elde edildi. Örnek: bu, hazır işlem başına ortalama yaklaşık AED 5.09 milyon, off-plan işlem başına ise AED 2.21 milyon demektir. Off-plan işlem sayısında kazanıyor; hazır stok ise sessizce paranın daha büyük kısmını taşıyor.
Ağustos, 2026'nın Şimdiye Kadarki Hikâyesine Nasıl Uyuyor
Sekiz aylık toplamlar Ağustos'u doğru ölçeğe oturtur. Voice of Emirates'in 1 Eylül 2026'da yayımladığı Dubai Land Department rakamlarına göre Dubai, 2026'nın ilk sekiz ayında 148,564 işlemde AED 523.44 milyar kaydetti; bunun AED 349.83 milyarı 112,020 işlemde satışlar, AED 134.34 milyarı 30,645 işlemde ipotekler ve AED 39.27 milyarı 5,899 işlemde hibelerdir. Satış rakamı içinde kaynak 94,480 konut ünitesi işlemi, 8,742 bina işlemi ve 8,794 arsa işlemini ayrıca gösterir.
Aynı kaynak bunu 2025 ile karşılaştırır: sekiz aylık toplam, geçen yılın tamamında kaydedilen AED 919 milyarın yaklaşık .96'sını temsil eder. Aylık bir manşet 'lık yıllık düşüş bildirdiğinde akılda tutulması gereken karşılaştırma budur. Dubai 2026'da olağanüstü bir 2025'in altında seyrediyor, ancak tarihsel olarak hâlâ çok büyük bir taban üzerinde.
Bu sekiz aydaki off-plan ve hazır stok ayrımı öğreticidir. Off-plan 76,650 işlemde AED 169.77 milyar, hazır stok ise 35,370 işlemde AED 180.05 milyar oluşturdu. Off-plan işlem sayısının kabaca üçte ikisini, ancak değerin yarısından biraz azını taşıdı. İkisini tartıyorsanız şu rehberimiz: Dubai'de off-plan ve hazır mülk karşılaştırması bu farkın bir alıcı için pratikte ne anlama geldiğini açıklar.
Çeyreklik bağlam için, Betterhomes'un 20 Temmuz 2026'da yayımlanan Dubai konut piyasası raporu 2026 2. çeyrekte AED 84.9 milyar değerinde 34,850 konut işlemi kaydetti; bu, yıllık bazda hacimde , değerde düşüş olmasına rağmen hâlâ kayıtlardaki üçüncü en yüksek ikinci çeyrekti. Aynı çeyrekte off-plan satışların 'sını tutarken ikinci el piyasa 'te kaldı ve AED 15 milyonun üzerindeki prime işlemler yıllık düştü — ancak off-plan lüks satışlar arttı. Betterhomes ayrıca kiracı taleplerinin yıllık arttığını bildirdi; bu, satış hacmiyle birlikte zayıflamayan bir kira talebi sinyalidir.
Bu ay kaynağını bulamadıklarımız
Ağustos 2026 için adı ve tarihi belirtilen bir kaynaktan ValuStrat Fiyat Endeksi değerini, ay için bölge düzeyinde yıllık fiyat değişim tablosunu, daire-villa fiyat ayrımını, ticari ve ofis rakamlarını veya şehir geneli kira seviyelerini alamadık. Temmuz rakamlarını aktarmak veya tahmin etmek yerine bunları dışarıda bıraktık. Bu raporda bir rakam yoksa, var olmadığı için değil, kaynağını bulamadığımız içindir.
Oca–Ağu 2026 — Tüm İşlemler
Kaynak: DLD, Voice of Emirates aracılığıyla, 1 Eyl 2026
Çeyreklik Bağlam — 2026 2. Çeyrek
Kaynak: Betterhomes raporu, 20 Tem 2026
Sıkça Sorulan Sorular
Dubai'nin Ağustos 2026 gayrimenkul verileri hakkında en sık sorulan sorular.
Piyasa Verilerini Karara Dönüştürün
Şehir geneli bir medyan, belirli bir kuledeki belirli bir ünite için ne ödemeniz gerektiğini söylemez. Ekibimiz canlı bölge düzeyindeki verilerle çalışır ve rakamlar bir alımı desteklemediğinde bunu size açıkça söyler.
Tartışmaya Katılın