عقارات دبي
بيانات السوق 2026
بيانات معاملات موثقة، متوسط الأسعار لكل قدم مربع، معدلات الإيجار، العائدات، واتجاهات السوق عبر جميع المجتمعات الرئيسية في دبي — تم الحصول عليها من دائرة الأراضي والأملاك في دبي وشركات الأبحاث الرائدة في السوق.
أسعار العقارات في دبي للقدم المربع - 2026
متوسط أسعار المعاملات لكل قدم مربع عبر مجتمعات دبي السكنية الرئيسية. الأرقام تعكس المبيعات المسجلة لدى دائرة الأراضي والأملاك في الربع الأول من عام 2026. أسعار العقارات قيد الإنشاء والجاهزة معروضة بشكل منفصل حيثما تتوفر البيانات.
المصادر: دائرة الأراضي والأملاك في دبي (DLD)، بروبرتي مونيتور، إنجل آند فولكرز، CBRE الربع الأول 2026
| مجتمع | نوع العقار | متوسط درهم إماراتي/قدم مربع | تغير سنوي | سعر الدخول | مستوى السوق |
|---|---|---|---|---|---|
| تلال الإمارات | فلل | ١٤,٥٠٠ درهم إماراتي+ | +11% | 35 مليون درهم إماراتي أو أكثر | الفاخر جدا |
| نخلة جميرا | شقق وفيلات | 3,500–4,000 درهم إماراتي | +14% | 2.5 مليون درهم إماراتي أو أكثر | رفاهية |
| وسط مدينة دبي | شقق | 2,800–3,200 درهم إماراتي | +13% | 1.8 مليون درهم إماراتي أو أكثر | ممتاز |
| دبي مارينا | شقق | ٢٬٤٠٠–٢٬٨٠٠ درهم إماراتي | +11% | 1.2 مليون درهم إماراتي + | ممتاز |
| دبي هيلز استيت | شقق وفيلات | 2,100–2,600 درهم إماراتي | +12% | ١٫٣ مليون درهم إماراتي+ | ممتاز |
| خليج الأعمال | شقق | ٢٠٠٠-٢٤٠٠ درهم إماراتي | +11% | ٩٠٠ ألف درهم إماراتي أو أكثر | مميز-متوسط |
| خور دبي | شقق | ١٬٩٠٠–٢٬٢٠٠ درهم إماراتي | +15% | 1.1 مليون درهم إماراتي أو أكثر | مميز-متوسط |
| جزر دبي | شقق وفيلات | ١٬٨٠٠–٢٬٢٠٠ درهم إماراتي | +16% | مليون درهم إماراتي+ | متوسط إلى مرتفع |
| اليلّايس / مدينة محمد بن راشد | منازل تاون هاوس وفلل | ١,٨٠٨ درهم إماراتي | +13% | 2 مليون درهم إماراتي أو أكثر | متوسط إلى مرتفع |
| قرية جميرا الدائرية (JVC) | شقق | ١٬٤٤٨–١٬٤٧٣ درهم إماراتي | +10% | ٤٥٠ ألف درهم إماراتي أو أكثر | متوسط السوق |
| دبي الجنوب | مختلط | ١٤٠٠–١٧٠٠ درهم إماراتي | +16% | 550 ألف درهم إماراتي أو أكثر | متوسط السوق |
| أرجان / دبي لاند | شقق | ١٬١٠٠–١٬٤٠٠ درهم إماراتي | +9% | 500 ألف درهم إماراتي+ | متوسط السوق |
| ديرة / بر دبي | شقق | ٨٠٠ - ١٠٠٠ درهم إماراتي | +7% | 350 ألف درهم إماراتي أو أكثر | بأسعار معقولة |
| المدينة الدولية | شقق | ٧٠٠-٨٥٠ درهم إماراتي | +8% | 350 ألف درهم إماراتي أو أكثر | بأسعار معقولة |
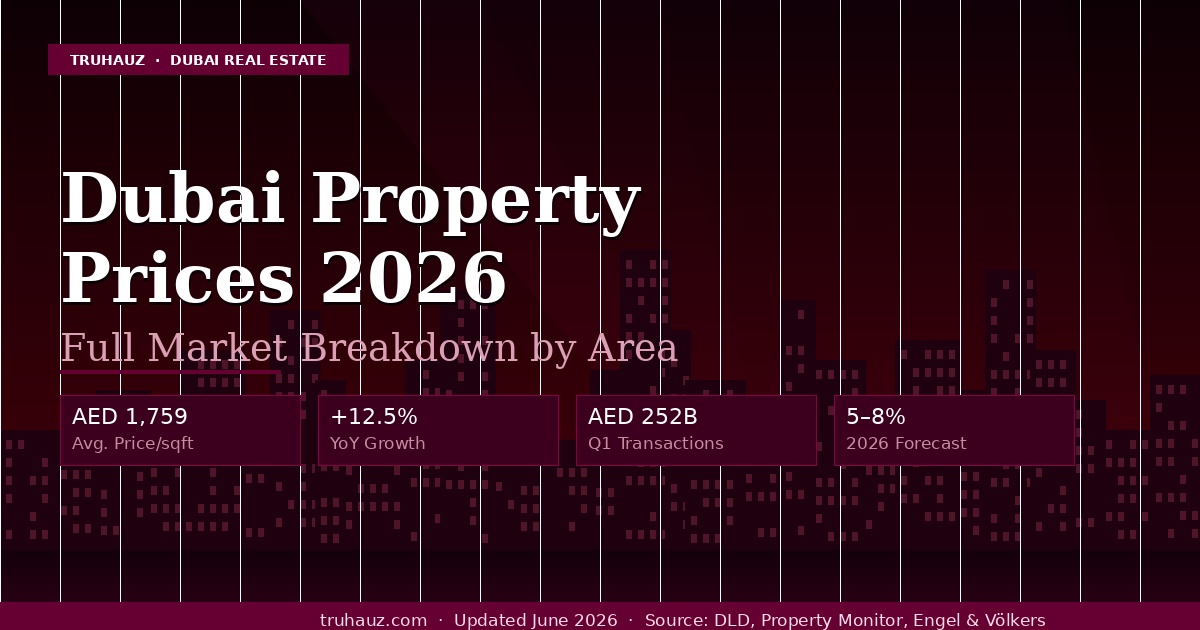
| متوسط سوق دبي | جميع الأنواع | ١٧٥٩ درهم إماراتي | +12.5% | — | الربع الأول 2026 |
الأسعار هي متوسطات للمعاملات المسجلة لدى دائرة الأراضي والأملاك. الوحدات الفردية تختلف حسب الطابق والإطلالة والتشطيب. البيانات: الربع الأول 2026.
متوسط الإيجارات السنوية في دبي حسب المنطقة — 2026
متوسط الإيجار السنوي بالدرهم الإماراتي للشقق حسب نوع الغرف عبر مجتمعات دبي الرئيسية. الأرقام هي الوسيطات السوقية بناءً على عقود الإيجار المسجلة في إيجاري وقوائم العرض الحية.
المصادر: مؤشر الدخل للإيجارات (إيجاري)، بيوت، بروبرتي فايندر، CBRE الربع الأول 2026
وسط مدينة دبي
حي برج خليفة · وسط المدينة
دبي مارينا
واجهة المارينا · مجاور جي بي آر
خليج الأعمال
مواجهة للقناة · مختلط الاستخدام
قرية جميرا الدائرية
منتصف السوق · أعلى حجم
دبي هيلز استيت
ضاحية · مجمع جولف
نخلة جميرا
جزيرة فاخرة · واجهة بحرية
المرابع العربية
مجمع فيلات · ضواحي
ديرة / بر دبي
أحياء تراثية · قلب المدينة
المدينة الدولية
أكثر المناطق امتلاكاً حرة بأسعار معقولة
إجمالي عائدات الإيجار حسب المنطقة — دبي 2026
العائد الإجمالي على الإيجار = الإيجار السنوي ÷ سعر الشراء × 100. وعادةً ما يكون العائد الصافي (بعد خصم رسوم الخدمات وتكاليف التشغيل) أقل من العائد الإجمالي بنسبة تتراوح بين 1.5 و2.5%. ويعتبر متوسط العائد الإجمالي في دبي البالغ 7.1% جيداً مقارنةً بلندن (3–4%) وسنغافورة (2–3%) ونيويورك (4–5%).
المصادر: CBRE الربع الأول 2026، Grovy Real Estate، Polaris Corporate Services، مؤشر DLD للإيجار
| مساحة | نوع العقار | إجمالي العائد | صافي العائد (تقديري) | متوسط سعر الشراء | متوسط الإيجار السنوي |
|---|---|---|---|---|---|
| المدينة الدولية | شقق | 9–10% | 7–8% | ٤٥٠ ألف درهم إماراتي | ٤٠٠٠٠–٤٥٠٠٠ درهم إماراتي |
| دبي للاستثمار بارك | شقق | 9–10.5% | 7–8.5% | ٥٠٠٠٠٠ درهم إماراتي | ٤٦ ألف - ٥٢ ألف درهم إماراتي |
| حدائق ديسكفري | شقق | 9–10% | 7–8% | 550 ألف درهم إماراتي | 50 ألف - 55 ألف درهم إماراتي |
| تاون سكوير | شقق ومنازل توين هاوس | ٧–٩% | ٥.٥–٧% | ٧٥٠ ألف درهم | ٥٦٠٠٠-٦٨٠٠٠ درهم إماراتي |
| قرية جميرا الدائرية | شقق | ٧–٩% | 5.5–6.5% | ٧٠٠ ألف درهم إماراتي | ٥٠ ألف - ٦٣ ألف درهم إماراتي |
| الفرجان | شقق وفيلات | 7–8.5% | ٥.٥–٧% | ٩٠٠ ألف درهم إماراتي | 65 ألف - 76 ألف درهم إماراتي |
| دبي الجنوب | مختلط | ٦–٨% | 4.5–6% | ٧٥٠ ألف درهم | ٤٨ ألف - ٦٠ ألف درهم إماراتي |
| خليج الأعمال | شقق | 6.5–7.6% | 4.5–5.5% | 1.1 مليون درهم | ٧٢٬٠٠٠ - ٨٤٬٠٠٠ درهم |
| دبي مارينا | شقق | 5.5–6.8% | 4–5% | ١٫٤ مليون درهم إماراتي | ٧٨ ألف - ٩٥ ألف درهم إماراتي |
| دبي هيلز استيت | شقق | 5.4–6% | 3.8–4.5% | 1.5 مليون درهم إماراتي | ٨٢ ألف - ٩٠ ألف درهم إماراتي |
| وسط مدينة دبي | شقق | 5–6.2% | 3.5–4.5% | 2 مليون درهم إماراتي | 100 ألف - 124 ألف درهم إماراتي |
| نخلة جميرا | شقق | 4–5% | 2.8–3.8% | 3.5 مليون درهم إماراتي | ١٤٠ ألف - ١٧٥ ألف درهم إماراتي |
| نخلة جميرا | فلل | 3.5–5% | 2.5–4% | 18 مليون درهم | ٦٥٠ ألف - ٩٠٠ ألف درهم إماراتي |
| تلال الإمارات | فلل | 2.5–4% | 1.8–3% | ٤٠ مليون درهم إماراتي أو أكثر | 1000000 - 1600000 درهم إماراتي |
| متوسط دبي | شقق | 7.1% إجمالي | 4.5–51 تيرابايت × 3 تيرابايت صافي | 1.1 مليون درهم | 78 ألف درهم إماراتي |
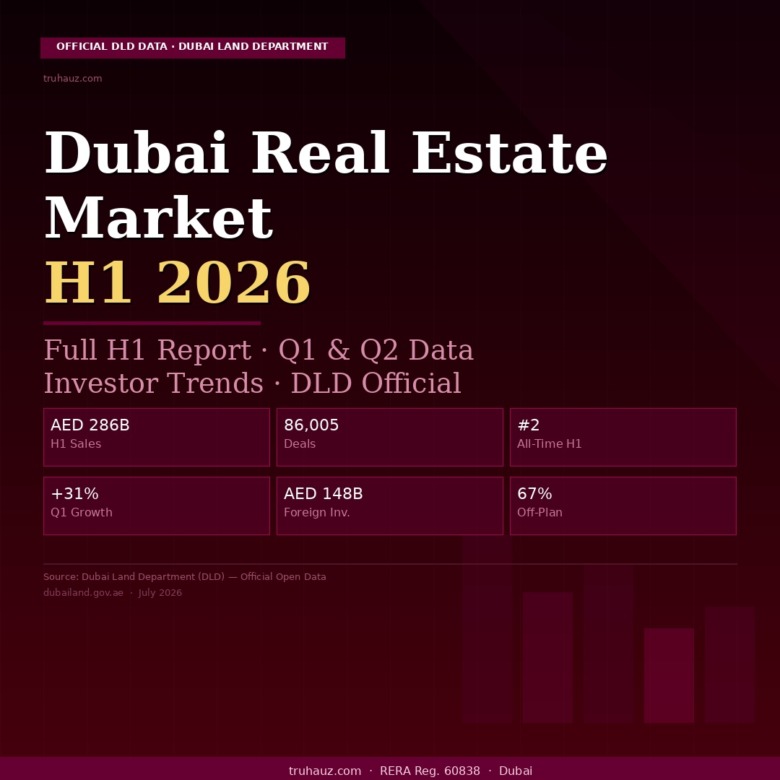
معاملات العقارات في دبي - الربع الأول 2026
المعاملات العقارية المسجلة لدى دائرة الأراضي والأملاك في دبي (DLD) للربع الأول من عام 2026. بلغت القيمة السوقية الإجمالية 252 مليار درهم إماراتي — بزيادة سنوية بلغت 31%. وبلغ عدد المعاملات 60,303 معاملة، بزيادة قدرها 6% مقارنة بالربع الأول من عام 2025.
المصدر: البيان الرسمي الصادر عن دائرة الأراضي والأملاك في دبي (DLD) للربع الأول من عام 2026
| مجتمع | صفقة الربع الأول 2026 | القيمة في الربع الأول من عام 2026 | متوسط السعر لكل صفقة |
|---|---|---|---|
| قرية جميرا الدائرية | 3,162 | 4.0 مليار درهم إماراتي | 1.26 مليون درهم إماراتي |
| دبي الجنوب | 2,889 | ٥.٤ مليار درهم | 1.87 مليون درهم إماراتي |
| وادي الصفا 5 | 2,694 | ٤٫٨ مليار درهم | 1.78 مليون درهم إماراتي |
| خليج الأعمال | 1,778 | 4.3 مليار درهم إماراتي | 2.42 مليون درهم إماراتي |
| جزر دبي | 1,285 | 3.2 مليار درهم | 2.49 مليون درهم إماراتي |
| خور دبي | 1,040 | 2.4 مليار درهم إماراتي | 2.31 مليون درهم إماراتي |
| وسط مدينة دبي | 557 | 2.8 مليار درهم إماراتي | 5.03 مليون درهم إماراتي |
| إجمالي سوق دبي | 60,303 | 252 مليار درهم إماراتي | 4.18 مليون درهم إماراتي في المتوسط. |
الوصول الرسمي لبيانات دائرة الأراضي والأملاك
تنشر دائرة الأراضي والأملاك في دبي بيانات المعاملات في الوقت الفعلي، ومؤشر أسعار العقارات السكنية (RPPI)، ومؤشر الإيجارات الرسمي من خلال بوابة البيانات المفتوحة الخاصة بها. للحصول على أرقام رسمية ومعتمدة: dubailand.gov.ae/en/open-data — مؤشر الإيجارات: دبي لاند.gov.ae/en/eservices/rental-index
السوق العقاري: العقارات تحت الإنشاء مقابل العقارات الجاهزة - دبي 2026
نما سوق العقارات على المخطط في دبي من 551 مليار درهم إماراتي في عام 2022 إلى ما بين 73 و781 مليار درهم إماراتي في عام 2026. ويعكس هذا التحول تفضيل المستثمرين لخطط السداد المرنة، والعروض الجديدة من كبرى شركات التطوير العقاري، والتوقعات القوية بارتفاع قيمة العقارات عند التسليم.
المصادر: أرابيان بزنس، دي إكس بي أناليتيكس، تقرير بيتر هومز للربع الأول 2026
حصة السوق بالقيمة - الربع الأول 2026
المعاملات قيد الإنشاء كحصة من القيمة الإجمالية لمعاملات العقارات
حصة السوق خارج المخطط – سنة بسنة
لقد نمت حصة المبيعات خارج الخريطة من قيمة معاملات دبي باستمرار
الشراء على المخطط في 2026 — حقائق رئيسية
ما يجب أن يعرفه المشترون عن سوق العقارات على الخارطة حاليًا
جاهز مقابل غير مخطط - مقارنة سريعة
أيّها الأنسب لاستراتيجية استثمارك؟
| حلل | خارج المخطط | جاهز |
|---|---|---|
| سعر الدخول | خفض (إطلاق) | سعر السوق |
| دخل فوري | لاشيء | من اليوم الأول |
| دفع | خطة مرحلية | اكتمال في النقل |
| رهن عقاري | خيارات محدودة | رهن عقاري كامل |
| ارتفاع رأس المال | إمكانات أعلى | متوسط |
| خطر | مخاطر البناء | أسفل |
مقارنة سريعة - جميع مناطق دبي الرئيسية
مقارنة سريعة للسعر والعائد وتكلفة الدخول ونشاط السوق عبر المجتمعات السكنية الرئيسية في دبي.
هل تريد بيانات سوق مخصصة لميزانيتك وأهدافك؟
تقدم TrueHauz استشارات استثمارية مجانية مدعومة ببيانات دائرة الأراضي والأملاك الحية. أخبرنا بما تبحث عنه - وسنجد القيمة.
اعثر على عقارك في دبي بالسعر المناسب
يقوم فريقنا بمراقبة بيانات DLD الحية يوميًا. سواء كنت تشتري أو تستثمر أو تبيع – نقدم لك معلومات سوق موثوقة، وليس تخمينًا.
تروهوز.كوم · اشترِ · قيد الإنشاء · تأشيرة ذهبية · بيانات مفتوحة DLD