Недвижимость в Дубае
Рыночные данные 2026
Проверенные данные о сделках, средние цены за квадратный фут, ставки аренды, доходность и рыночные тенденции по всем основным районам Дубая — на основе данных Департамента земельных ресурсов Дубая и ведущих фирм по исследованию рынка.
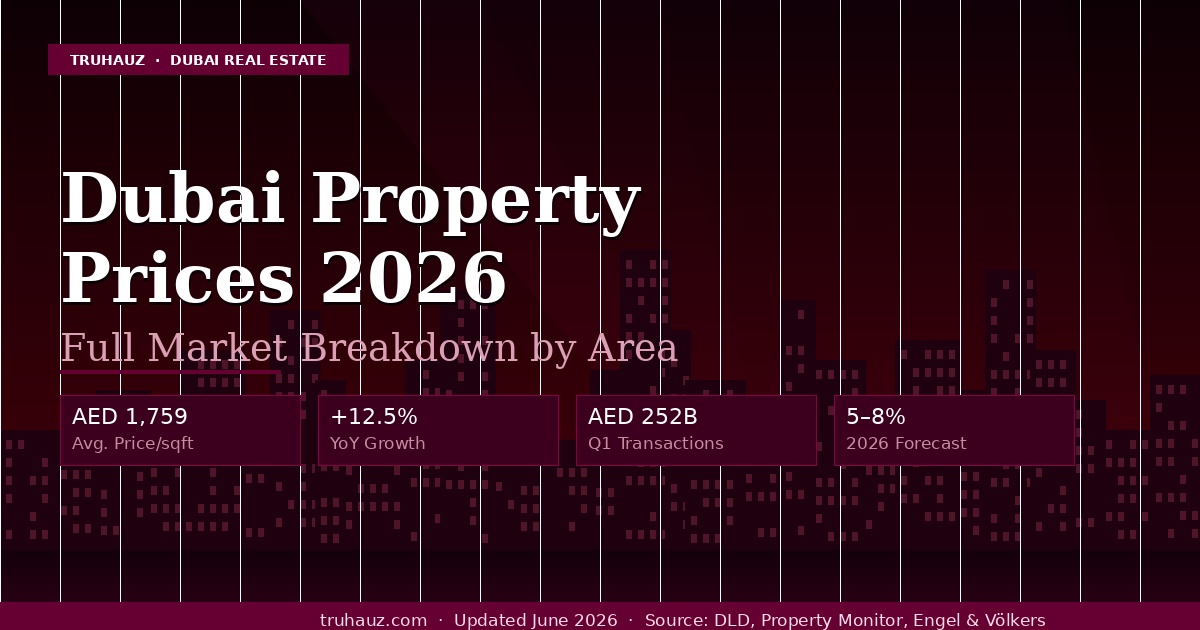
Цены на недвижимость в Дубае за квадратный фут — 2026
Средние цены транзакций за квадратный фут в основных жилых районах Дубая. Цифры отражают продажи, зарегистрированные DLD в первом квартале 2026 года. Цены на объекты вне плана и готовые объекты указаны отдельно, где имеются данные.
Источники: Департамент земельных ресурсов Дубая (DLD), Property Monitor, Engel & Völkers, CBRE Q1 2026
| Сообщество | Тип недвижимости | Средний АЕД/кв. фут | Изменения год к году | Начальная цена | Рыночный сегмент |
|---|---|---|---|---|---|
| Эмирейтс Хиллз | Виллы | 14 500+ дирхамов ОАЭ | +11% | 35 млн дирхамов и более | Ультра-роскошь |
| Пальма Джумейра | Квартиры и виллы | 3500–4000 дирхам | +14% | 2,5 млн. дирхамов ОАЭ+ | Роскошь |
| Downtown Дубая | Апартаменты | 2800–3200 ОАЭ дирхам | +13% | 1,8 миллиона дирхамов ОАЭ+ | Премиум |
| Дубай Марина | Апартаменты | 2 400–2 800 дирхам | +11% | 1.2 млн дирхамов ОАЭ+ | Премиум |
| Дубай Хиллс Эстейт | Квартиры и виллы | 2 100–2 600 дирхамов ОАЭ | +12% | 1,3 млн дирхамов ОАЭ + | Премиум |
| Бизнес-Бэй | Апартаменты | 2 000–2 400 дирхамов | +11% | 900 000+ дирхамов ОАЭ | Высший–Средний |
| Дубай-Крик | Апартаменты | 1 900–2 200 ОАЭ дирхам | +15% | более 1,1 млн дирхамов | Высший–Средний |
| Дубайские острова | Квартиры и виллы | 1 800–2 200 дирхамов ОАЭ | +16% | 1,0 млн дирхамов ОАЭ+ | Средний-Премиум |
| Аль Йелаисс / Город Мохаммеда бин Рашида | Таунхаусы и виллы | 1 808 дирхам ОАЭ | +13% | более 2 млн дирхамов | Средний-Премиум |
| Jumeirah Village Circle (JVC) | Апартаменты | 1 448–1 473 дирхамов ОАЭ | +10% | 450 тысяч дирхамов ОАЭ+ | Средний рынок |
| Дубай Южный | Смешанный | 1 400–1 700 дирхамов ОАЭ | +16% | 550 000+ дирхамов | Средний рынок |
| Арджан / Дубайленд | Апартаменты | 1100–1400 дирхамов ОАЭ | +9% | 500 тыс. дирхамов ОАЭ+ | Средний рынок |
| Дейра / Бур Дубай | Апартаменты | 800–1000 дирхамов ОАЭ | +7% | 350 000+ дирхамов ОАЭ | Доступный |
| Международный город | Апартаменты | 700–850 ОАЭ | +8% | 350 000+ дирхамов ОАЭ | Доступный |
| Средний рынок Дубая | Все типы | 1759 ОАЭ дирхам | +12.5% | — | Q1 2026 |
Цены являются средними показателями сделок, зарегистрированных DLD. Стоимость отдельных единиц варьируется в зависимости от этажа, вида и отделки. Данные: 1 кв. 2026 г.
Средняя годовая арендная плата в Дубае по районам — 2026
Средняя годовая арендная плата в дирхамах ОАЭ за квартиры по количеству спален в крупных районах Дубая. Цифры представляют собой медианные значения на рынке, основанные на зарегистрированных в Ejari договорах аренды и актуальных предложениях.
Источники: DLD Rental Index (Ejari), Bayut, Property Finder, CBRE Q1 2026
Downtown Дубая
Район Бурдж-Халифа · центр города
Дубай Марина
Прибрежный район · Рядом с JBR
Бизнес-Бэй
С видом на канал · смешанного назначения
Джумейра Виллидж Серкл
Средний ценовой сегмент · наибольший объем
Дубай Хиллс Эстейт
Пригородный · гольф-курорт
Пальма Джумейра
Роскошный остров · на набережной
Арабские Ранчо
Поселок вилл · пригородный
Дейра / Бур Дубай
Исторические районы · центр города
Международный город
Самый доступный район с правом собственности
Валовая рентная доходность по районам — Дубай 2026
Валовая доходность от аренды = годовая арендная плата ÷ цена покупки × 100. Чистая доходность (за вычетом коммунальных платежей и эксплуатационных расходов) обычно на 1,5–2,51% ниже валовой. Средняя валовая доходность в Дубае (7,11%) выглядит выгодно по сравнению с Лондоном (3–4%), Сингапуром (2–3%) и Нью-Йорком (4–5%).
Источники: CBRE Q1 2026, Grovy Real Estate, Polaris Corporate Services, DLD Rental Index
| Область | Тип недвижимости | Валовая прибыль | Чистая прибыль (приблизительно) | Средняя цена покупки | Средняя годовая арендная плата |
|---|---|---|---|---|---|
| Международный город | Апартаменты | 9–10% | 7–8% | 450 000 дирхамов ОАЭ | 40–45 тыс. дирхамов |
| Дубай Инвестментс Парк | Апартаменты | 9–10.5% | 7–8.5% | 500 000 дирхамов ОАЭ | 46 000–52 000 дирхамов ОАЭ |
| Сады открытий | Апартаменты | 9–10% | 7–8% | 550 000 А.Э.Д. | 50 000–55 000 дирхамов |
| Городская площадь | Квартиры и таунхаусы | 7-9% | 5.5-7% | 750 000 дирхамов ОАЭ | 56 000–68 000 дирхамов ОАЭ |
| Джумейра Виллидж Серкл | Апартаменты | 7-9% | 5.5–6.5% | 700 000 ОАЭ дирхам | 50–63 тыс. дирхамов ОАЭ |
| Аль-Фурджан | Квартиры и виллы | 7–8.5% | 5.5-7% | 900 000 дирхамов ОАЭ | 65 000–76 000 дирхамов ОАЭ |
| Дубай Южный | Смешанный | 6-8% | 4.5–6% | 750 000 дирхамов ОАЭ | 48–60 тыс. дирхамов ОАЭ |
| Бизнес-Бэй | Апартаменты | 6.5–7.6% | 4.5–5.5% | 1,1 млн дирхамов | 72 000–84 000 дирхамов ОАЭ |
| Дубай Марина | Апартаменты | 5.5–6.8% | 4–5% | 1,4 млн дирхамов | 78 000–95 000 дирхамов ОАЭ |
| Дубай Хиллс Эстейт | Апартаменты | 5.4–6% | 3.8–4.5% | 1,5 млн дирхамов | 82 000–90 000 дирхамов ОАЭ |
| Downtown Дубая | Апартаменты | 5–6.2% | 3.5–4.5% | 2,0 млн дирхамов | 100 000–124 000 ОАЭ |
| Пальма Джумейра | Апартаменты | 4–5% | 2.8–3.8% | 3,5 млн дирхамов | 140 000 – 175 000 дирхамов ОАЭ |
| Пальма Джумейра | Виллы | 3.5–5% | 2.5–4% | 18 млн дирхамов | 650 000–900 000 дирхамов ОАЭ |
| Эмирейтс Хиллз | Виллы | 2.5–4% | 1.8–3% | 40+ миллионов дирхамов | 1–1,6 миллиона дирхамов |
| Дубай в среднем | Апартаменты | 7.1% (брутто) | 4,5–51 ТП3Т нетто | 1,1 млн дирхамов | 78 000 АЭД |
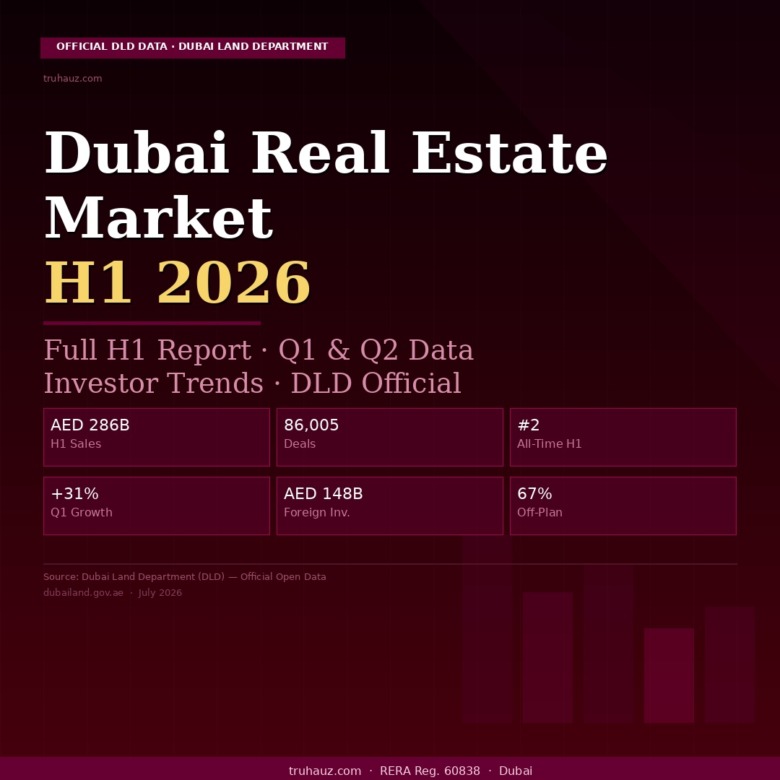
Сделки с недвижимостью в Дубае — 1 квартал 2026 г.
Сделки с недвижимостью, зарегистрированные в DLD за 1-й квартал 2026 года. Общая рыночная стоимость составила 252 млрд дирхамов — рост на 311 % по сравнению с аналогичным периодом прошлого года. Объем сделок достиг 60 303, что на 61 % больше, чем в 1-м квартале 2025 года.
Департамент земельных ресурсов Дубая (DLD) Официальный релиз 1 квартала 2026 года
| Сообщество | Сделки 1 квартала 2026 | 1 квартал 2026 года | Средняя цена/предложение |
|---|---|---|---|
| Джумейра Виллидж Серкл | 3,162 | 4,0 млрд дирхамов ОАЭ | 1,26 млн дирхамов |
| Дубай Южный | 2,889 | 5,4 млрд дирхамов | 1,87 млн дирхамов ОАЭ |
| Вади Аль Сафа 5 | 2,694 | 4,8 млрд дирхамов ОАЭ | 1,78 млн дирхамов |
| Бизнес-Бэй | 1,778 | 4,3 млрд дирхамов ОАЭ | 2,42 млн дирхамов ОАЭ |
| Дубайские острова | 1,285 | 3,2 млрд дирхамов | 2,49 млн дирхамов |
| Дубай-Крик | 1,040 | 2.4 миллиарда дирхамов | 2,31 млн Дирхамов ОАЭ |
| Downtown Дубая | 557 | 2,8 млрд дирхамов | 5.03 млн дирхамов ОАЭ |
| Общий рынок Дубая | 60,303 | 252В АЕД | 114000000,18 руб. в среднем. |
Официальный доступ к данным DLD
Департамент земельных ресурсов Дубая публикует данные о транзакциях в реальном времени, индекс цен на жилую недвижимость (RPPI) и официальный индекс арендной платы через свой портал открытых данных. Для проверенных, официальных данных: dubailand.gov.ae/ru/open-data — Индекс аренды: dubailand.gov.ae/ru/eservices/rental-index
Незавершенное строительство против готовой недвижимости на рынке — Дубай 2026
Объем рынка недвижимости на стадии строительства в Дубае вырос с 551 млрд дирхамов в 2022 году до 73–781 млрд дирхамов в 2026 году. Такой рост обусловлен предпочтением инвесторов гибким схемам оплаты, появлением новых объектов от ведущих застройщиков, а также прогнозируемым значительным ростом стоимости недвижимости после сдачи объектов.
Источники: Arabian Business, DXB Analytics, Отчет Betterhomes за 1 квартал 2026 г.
Доля рынка по стоимости — 1 квартал 2026 г.
Сделки на этапе строительства в доле от общей стоимости сделок с недвижимостью
Доля рынка на этапе строительства — год за годом
Доля сделок на этапе строительства в структуре стоимости транзакций в Дубае последовательно росла.
Покупка на этапе строительства в 2026 году — Ключевые факты
Что должны знать покупатели о текущем рынке жилья на этапе строительства
Готовое жилье против жилья на стадии строительства — Быстрое Сравнение
Что подходит для вашей инвестиционной стратегии?
| Фактор | На стадии строительства | Готовые |
|---|---|---|
| Входная цена | Нижний (запуск) | Рыночная ставка |
| Немедленный доход | Ничего | С самого первого дня |
| Оплата | Поэтапный план | Полная передача |
| Ипотека | Ограниченные варианты | Полная ипотека |
| Капитальный рост | Более высокий потенциал | Умеренный |
| Риск | Строительный риск | Ниже |
Краткое сравнение — все основные районы Дубая
Сравнительная таблица цен, доходности, стоимости входа и рыночной активности по ключевым жилым районам Дубая.
Хотите персонализированные рыночные данные для вашего бюджета и целей?
TruHauz предоставляет бесплатные консультации по инвестициям, подкрепленные актуальными данными DLD. Расскажите, что вы ищете — мы найдем, где находится ценность.
Найдите вашу недвижимость в Дубае по правильной цене
Наша команда ежедневно отслеживает актуальные данные DLD. Независимо от того, покупаете вы, инвестируете или продаете — мы предоставим вам проверенную рыночную информацию, а не догадки.
трухаус.com · Купить · Вне плана · Золотая виза · Открытые данные DLD