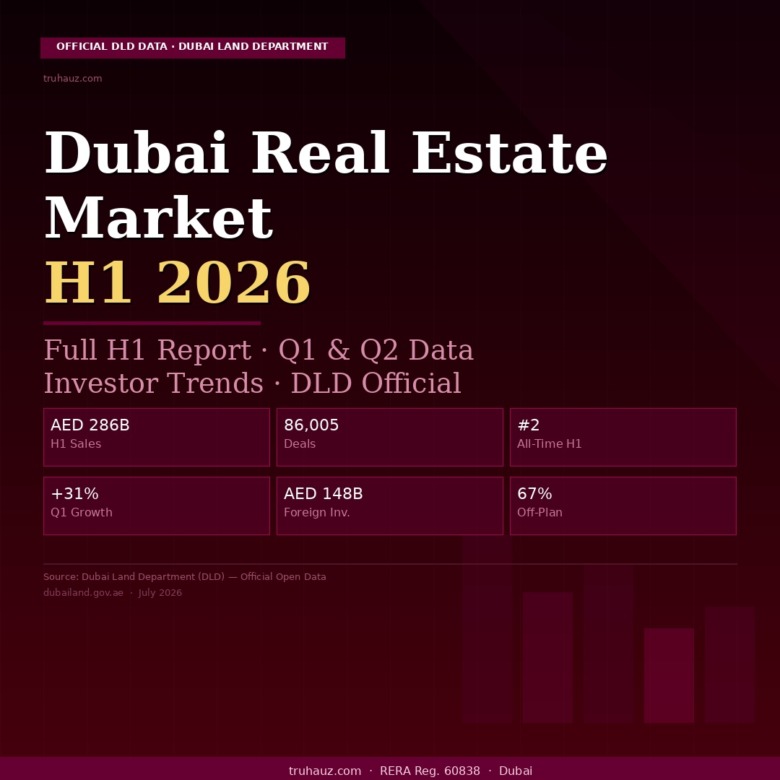
املاک دبی
دادههای بازار ۲۰۲۶
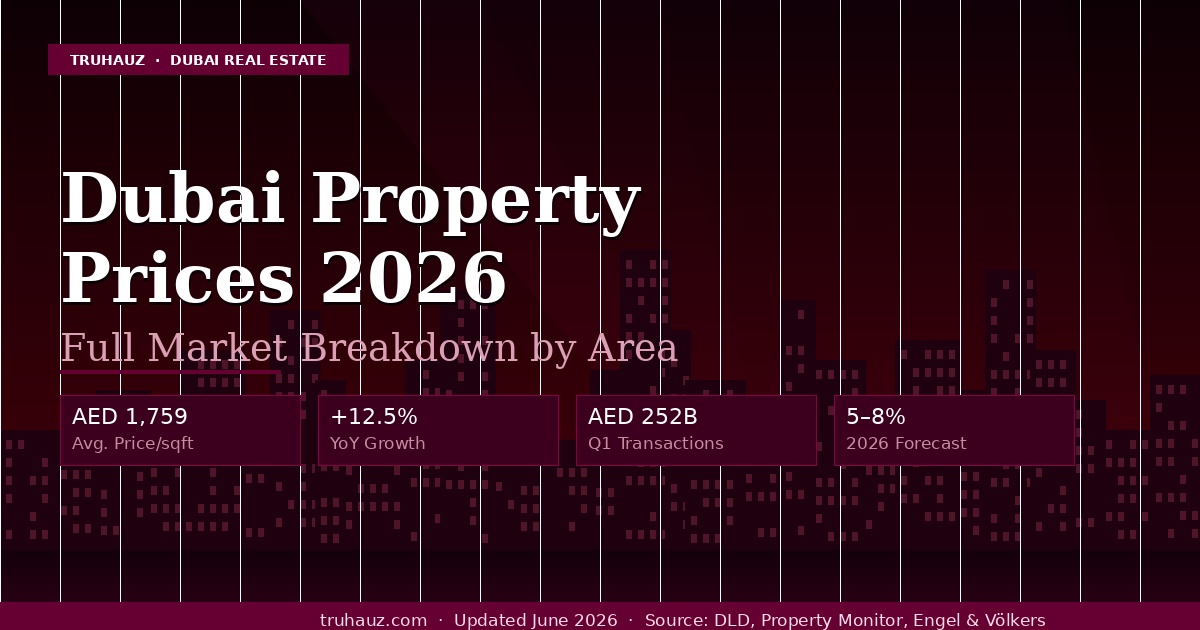
دادههای تراکنش تأیید شده، میانگین قیمتها به ازای هر فوت مربع، نرخ اجاره، بازدهی و روندهای بازار در تمام جوامع اصلی دبی - که از اداره زمین دبی و شرکتهای پیشرو در تحقیقات بازار تهیه شده است.
قیمت املاک دبی به ازای هر فوت مربع — ۲۰۲۶
متوسط قیمت معاملات به ازای هر فوت مربع در جوامع مسکونی اصلی دبی. ارقام نشاندهنده فروشهای ثبتشده در DLD در سهماهه اول ۲۰۲۶ هستند. قیمتهای فروش پیشفروش و واحدهای آماده بهصورت جداگانه در صورت موجود بودن دادهها نمایش داده شدهاند.
منابع: اداره زمین دبی (DLD)، پراپرتی مانیتور، انگل و فولکرز، CBRE سهماهه اول ۲۰۲۶
| جامعه | نوع ملک | متوسط درهم امارات/فوت مربع | تغییر سال به سال | قیمت ورودی | سطح بازار |
|---|---|---|---|---|---|
| امیرتس هیلز | ویلاییها | ۱۴,۵۰۰+ درهم | +11% | ۳۵ میلیون درهم امارات | فوق لوکس |
| پالم جمیرا | آپارتمانها و ویلاها | ۳,۵۰۰ تا ۴,۰۰۰ درهم امارات | +14% | بیش از ۲.۵ میلیون درهم امارات | لوکس |
| مرکز شهر دبی | آپارتمانها | ۲۸۰۰ تا ۳۲۰۰ درهم امارات | +13% | ۱.۸ میلیون درهم به بالا | پرمیوم |
| مارینا دبی | آپارتمانها | ۲۴۰۰–۲۸۰۰ درهم امارات | +11% | بیش از ۱.۲ میلیون درهم امارات | پرمیوم |
| املاک تپههای دبی | آپارتمانها و ویلاها | ۲۱۰۰–۲۶۰۰ درهم امارات | +12% | ۱.۳ میلیون درهم به بالا | پرمیوم |
| خلیج کسبوکار | آپارتمانها | ۲٬۰۰۰ تا ۲٬۴۰۰ درهم امارات | +11% | بیش از ۹۰۰ هزار درهم امارات | پریمیم–میانرده |
| خلیج دبی کریک هاربر | آپارتمانها | ۱٬۹۰۰–۲٬۲۰۰ درهم امارات | +15% | ۱.۱ میلیون درهم به بالا | پریمیم–میانرده |
| جزایر دبی | آپارتمانها و ویلاها | ۱٬۸۰۰–۲٬۲۰۰ درهم امارات | +16% | ۱ میلیون درهم به بالا | میانرده-پرمیوم |
| العلییس / مدينة محمد بن راشد | تاون هاوس و ویلا | ۱۸۰۸ درهم امارات | +13% | ۲ میلیون درهم به بالا | میانرده-پرمیوم |
| میدان ویلج جمیرا (JVC) | آپارتمانها | ۱٬۴۴۸–۱٬۴۷۳ درهم امارات | +10% | ۴۵۰ هزار درهم به بالا | بازار میانی |
| دبی ساوت | مخلوط | ۱۴۰۰–۱۷۰۰ درهم امارات | +16% | ۵۵۰ هزار درهم به بالا | بازار میانی |
| ارجان / دبي لاند | آپارتمانها | ۱۱۰۰–۱۴۰۰ درهم امارات | +9% | ۵۰۰ هزار درهم به بالا | بازار میانی |
| دیره / برج دبی | آپارتمانها | ۸۰۰ تا ۱۰۰۰ درهم امارات | +7% | ۳۵۰ هزار درهم به بالا | مقرون به صرفه |
| شهر بینالمللی | آپارتمانها | ۷۰۰–۸۵۰ درهم امارات | +8% | ۳۵۰ هزار درهم به بالا | مقرون به صرفه |
| میانگین بازار دبی | همه انواع | ۱٬۷۵۹ درهم امارات | +12.5% | — | سه ماهه اول ۲۰۲۶ |
قیمتها میانگین معاملات ثبت شده در DLD هستند. واحدها بر اساس طبقه، نما و پرداخت متفاوت خواهند بود. دادهها: سهماهه اول ۲۰۲۶.
میانگین اجاره سالانه دبی بر اساس منطقه - ۲۰۲۶
میانگین اجاره سالانه به درهم امارات برای آپارتمانها بر اساس تعداد اتاق خواب در جوامع اصلی دبی. ارقام، میانگین بازار بر اساس قراردادهای ثبت شده در ایجاری و فهرستهای زنده است.
منابع: شاخص اجاره DLD (ایجاری)، بیوت، پراپرتي فايندر، CBRE فصل اول 2026
مرکز شهر دبی
منطقه برج خلیفه · مرکز شهر
مارینا دبی
ساحلی · مجاور JBR
خلیج کسبوکار
رو به کانال - کاربری مختلط
دایرهٔ روستای جمیرا
میانبازار · بیشترین حجم
املاک تپههای دبی
حومه شهر · مجموعه گلف
پالم جمیرا
جزیره لوکس · ساحلی
مزرعههای عربی
مجتمع ویلایی · حومه شهر
دیره / برج دبی
مناطق میراثی · هسته شهر
شهر بینالمللی
مقرون به صرفه ترین منطقه آزاد
بازده اجاره ناخالص بر اساس منطقه — دبی ۲۰۲۶
بازده ناخالص اجاره = اجاره سالانه ÷ قیمت خرید × ۱۰۰. بازده خالص (پس از هزینههای خدمات و هزینههای عملیاتی) معمولاً ۱.۵–۲.۵۱TP3T کمتر از بازده ناخالص است. بازده ناخالص متوسط دبی معادل ۷٫۱۱٪ است که در مقایسه با لندن (۳–۴٪)، سنگاپور (۲–۳٪) و نیویورک (۴–۵٪) مطلوبتر است.
منابع: سیبیآرئی سهماهه اول ۲۰۲۶، گرووی پراپرتی، خدمات شرکتی پولاریس، شاخص اجاره دیالدی
| مساحت | نوع ملک | بازده ناخالص | بازده خالص (تخمین) | میانگین قیمت خرید | میانگین اجاره سالانه |
|---|---|---|---|---|---|
| شهر بینالمللی | آپارتمانها | 9–10% | 7–8% | ۴۵۰۰۰۰ درهم | ۴۰ هزار تا ۴۵ هزار درهم |
| Dubai Investments Park | آپارتمانها | 9–10.5% | 7–8.5% | ۵۰۰ هزار درهم | ۴۶ هزار تا ۵۲ هزار درهم |
| دیسکاوری گاردنز | آپارتمانها | 9–10% | 7–8% | ۵۵۰ هزار درهم | ۵۰-۵۵ هزار درهم |
| میدان شهر | آپارتمانها و خانههای شهری | 7–9% | 5.5–7% | ۷۵۰ هزار درهم | ۵۶ هزار تا ۶۸ هزار درهم |
| دایرهٔ روستای جمیرا | آپارتمانها | 7–9% | 5.5–6.5% | ۷۰۰٬۰۰۰ درهم | ۵۰ هزار تا ۶۳ هزار درهم |
| الفرجان | آپارتمانها و ویلاها | 7–8.5% | 5.5–7% | ۹۰۰ هزار درهم | ۶۵ هزار تا ۷۶ هزار درهم امارات |
| دبی ساوت | مخلوط | 6–8% | 4.5–6% | ۷۵۰ هزار درهم | ۴۸٬۰۰۰ تا ۶۰٬۰۰۰ درهم امارات |
| خلیج کسبوکار | آپارتمانها | 6.5–7.6% | 4.5–5.5% | ۱.۱ میلیون درهم | ۷۲ هزار تا ۸۴ هزار درهم |
| مارینا دبی | آپارتمانها | 5.5–6.8% | 4–5% | ۱.۴ میلیون درهم | ۷۸۰۰۰ تا ۹۵۰۰۰ درهم امارات |
| املاک تپههای دبی | آپارتمانها | 5.4–6% | 3.8–4.5% | ۱.۵ میلیون درهم | ۸۲,۰۰۰–۹۰,۰۰۰ درهم |
| مرکز شهر دبی | آپارتمانها | 5–6.2% | 3.5–4.5% | ۲ میلیون درهم | ۰۰۰ ۱۰۰–۰۰۰ ۱۲۴ درهم |
| پالم جمیرا | آپارتمانها | 4–5% | 2.8–3.8% | ۳.۵ میلیون درهم | ۱۴۰ هزار تا ۱۷۵ هزار درهم |
| پالم جمیرا | ویلاییها | 3.5–5% | 2.5–4% | ۱۸ میلیون درهم | ۶۵۰ هزار تا ۹۰۰ هزار درهم |
| امیرتس هیلز | ویلاییها | 2.5–4% | 1.8–3% | ۴۰ میلیون درهم به بالا | ۱ میلیون تا ۱.۶ میلیون درهم امارات |
| میانگین دبی | آپارتمانها | 7.1% ناخالص | ۴.۵–۵۱TP3T خالص | ۱.۱ میلیون درهم | ۷۸ هزار درهم |
معاملات املاک دبی - سه ماهه اول ۲۰۲۶
معاملات املاک ثبتشده در DLD برای سهماهه اول سال ۲۰۲۶. ارزش کل بازار به ۲۵۲ میلیارد درهم امارات رسید — افزایش ۳۱۱ درصدی نسبت به سال قبل. حجم معاملات به ۶۰٬۳۰۳ مورد رسید که ۶۱ درصد نسبت به سهماهه اول سال ۲۰۲۵ افزایش داشته است.
دپارتمان اراضی دبی (DLD) - انتشار رسمی سه ماهه اول ۲۰۲۶
| جامعه | معاملات سه ماهه اول ۲۰۲۶ | ارزش سه ماهه اول ۲۰۲۶ | میانگین قیمت/معامله |
|---|---|---|---|
| دایرهٔ روستای جمیرا | 3,162 | ۴.۰ میلیارد درهم | ۱.۲۶ میلیون درهم |
| دبی ساوت | 2,889 | ۵.۴ میلیارد درهم | ۱.۸۷ میلیون درهم |
| وادی الصفا ۵ | 2,694 | ۴.۸ میلیارد درهم | ۱.۷۸ میلیون درهم امارات |
| خلیج کسبوکار | 1,778 | ۴.۳ میلیارد درهم | ۲.۴۲ میلیون درهم |
| جزایر دبی | 1,285 | ۳.۲ میلیارد درهم | ۲.۴۹ میلیون درهم |
| خلیج دبی کریک هاربر | 1,040 | ۲.۴ میلیارد درهم | ۲.۳۱ میلیون درهم امارات |
| مرکز شهر دبی | 557 | ۲.۸ میلیارد درهم | ۵.۰۳ میلیون درهم |
| کل بازار دبی | 60,303 | ۲۵۲ میلیارد درهم | ۴.۱۸ میلیون درهم به طور متوسط. |
دسترسی رسمی به دادههای DLD
اداره زمین دبی دادههای معاملات لحظهای، شاخص قیمت املاک مسکونی (RPPI) و شاخص رسمی اجاره را از طریق پورتال دادههای باز خود منتشر میکند. برای ارقام تأیید شده و رسمی: دبي لاند.gov.ae/fa/open-data - شاخص اجاره: dubailand.gov.ae/ar/eservices/rental-index
بازار املاک پیشساخت در مقابل املاک آماده - دبی ۲۰۲۶
بازار پیشفروش دبی از ارزش معاملاتی ۵۵۱ میلیارد در سال ۲۰۲۲ به ۷۳ تا ۷۸۱ میلیارد در سال ۲۰۲۶ افزایش یافته است. این تغییر نشاندهنده ترجیح سرمایهگذاران به طرحهای پرداخت انعطافپذیر، عرضه جدید از سوی توسعهدهندگان پیشرو و رشد قوی پیشبینیشده ارزش سرمایه در زمان تحویل است.
منابع: آرابین بیزینس، دیاکسبی انالیتیکس، گزارش سهماهه اول ۲۰۲۶ بترهومز
سهم بازار بر اساس ارزش - فصل اول ۲۰۲۶
معاملات پیشفروش به عنوان سهمی از کل ارزش معاملات املاک
سهم بازار پیشفروش - سال به سال
سهم املاک پیشفروش از ارزش تراکنشهای دبی به طور مداوم افزایش یافته است
خرید پیشفروش ملک در سال ۲۰۲۶ - حقایق کلیدی
آنچه خریداران باید درباره بازار پیشساخت فعلی بدانند
آماده در مقابل طرح - مقایسه سریع
کدام یک برای استراتژی سرمایه گذاری شما مناسب است؟
| فاکتور | پیشفروش | اماده |
|---|---|---|
| قیمت ورودی | پایین (پرتاب) | نرخ بازار |
| درآمد فوری | هیچ | از روز اول |
| پرداخت | برنامه مرحلهای | انتقال کامل |
| رهن | گزینههای محدود | رهن کامل |
| رشد سرمایه | پتانسیل بالاتر | متوسط |
| خطر | ریسک ساخت و ساز | پایین |
مقایسه سریع - تمامی مناطق اصلی دبی
مقایسه اجمالی قیمت، بازده، هزینه ورودی و فعالیت بازار در جوامع مسکونی کلیدی دبی.
آیا دادههای بازار سفارشی شده برای بودجه و اهداف خود را میخواهید؟
تروهوز مشاوره سرمایهگذاری رایگان را با پشتوانه دادههای زنده DLD ارائه میدهد. آنچه را که به دنبال آن هستید به ما بگویید - ما ارزش آن را پیدا خواهیم کرد.
ملک دبی خود را با قیمت مناسب پیدا کنید
تیم ما دادههای زنده DLD را به صورت روزانه رصد میکند. چه در حال خرید، سرمایهگذاری یا فروش باشید، ما اطلاعات معتبر بازار را به شما میدهیم، نه حدس و گمان.
تروهاوز.کام · خرید · پیشفروش · ویزای طلایی · دادههای باز DLD