
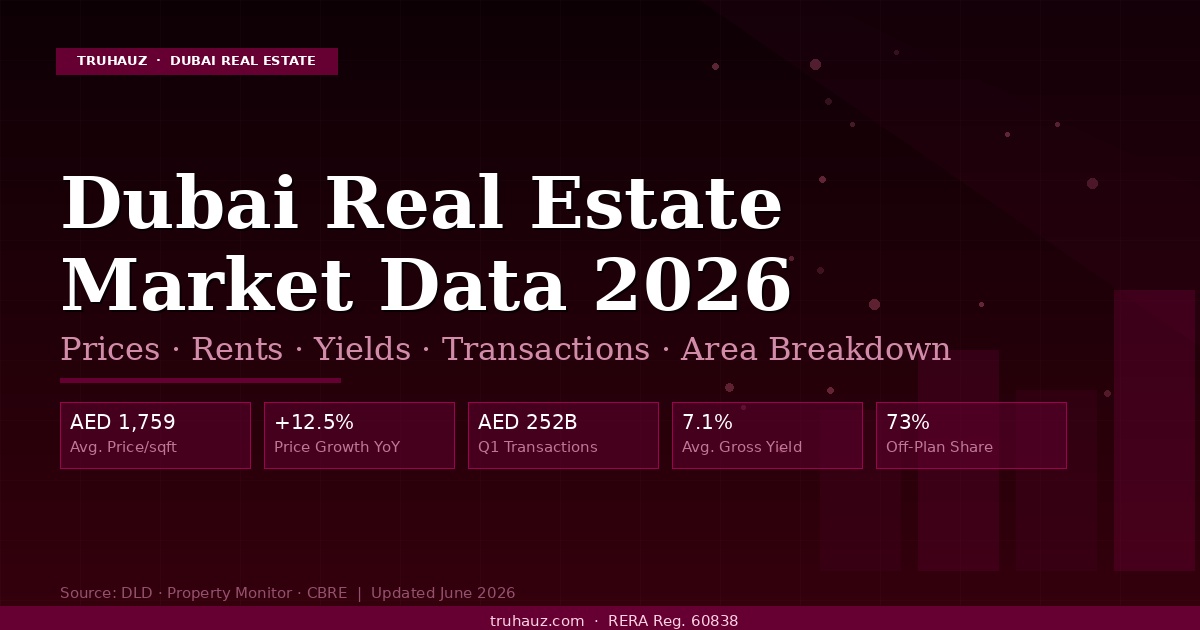
Dubai Real Estate Market Report
July 2026
Volumes recovered month-on-month, prices slipped a fraction, and the annual comparison stayed firmly negative. Every figure below is attributed to a named source and a publication date — including the places where the sources disagree.
What Actually Happened in July 2026
July 2026 was the second consecutive month in which Dubai’s residential market moved in the right direction on volume while continuing to give back a little on price. Neither movement was dramatic. Taken together they describe a market that has stopped falling quickly and has not yet started rising.
On price, the ValuStrat Price Index for Dubai residential property stood at 219.2 points in July 2026, down 0.3% month-on-month and 1.6% year-on-year, as reported by Khaleej Times on 12 August 2026. ValuStrat’s own commentary was that marginal monthly value declines suggest the market is moving toward stability. Set against monthly declines of roughly 6% in March, 2% in April and 1% in May and June — figures ValuStrat published in its Q2 review, reported by Khaleej Times on 21 July 2026 — a 0.3% slip is a substantially flatter curve.
On volume, ready-home transactions rose for a second straight month. ValuStrat counted 3,546 ready-property transactions in July, up 11.4% on June but 26.4% below July 2025. That pairing is the story of the month in one line: recovering from the spring, still well short of last year.
Dubai Market Snapshot — July 2026
Each figure attributed in the table below
July 2026 Headline Indicators
Dubai’s monthly data is published by several houses working from Dubai Land Department records. They do not always count the same basket. Where they differ, both figures are shown with their scope rather than averaged into a single number.
| Indicator | July 2026 | Change | Scope | Source & Date |
|---|---|---|---|---|
| Residential sales value | AED 25.95 billion | — | Residential only | Springfield Properties Dubai Real Estate Report |
| معاملات مسکونی | 12,748 | — | Residential only | Springfield Properties Dubai Real Estate Report |
| Commercial sales | AED 7.45B / 1,011 deals | — | Commercial only | Springfield Properties Dubai Real Estate Report |
| Total sales, all segments | 13,930 / AED 34.88B | +6.9% value MoM | All segments, DLD data | Al Masdar Al Aqaari, 31 Jul 2026 |
| Off-plan sales | 9,622 / AED 15.96B | ~69% of transactions | All segments, DLD data | Al Masdar Al Aqaari, 31 Jul 2026 |
| Ready-home sales | 4,308 / AED 18.92B | ~54% of total value | All segments, DLD data | Al Masdar Al Aqaari, 31 Jul 2026 |
| Off-plan share of volume | 70.8% | 58.9% of value | Residential only | Springfield Properties Dubai Real Estate Report |
| Off-plan share of sales | 72.8% | — | All residential sales | ValuStrat, via Khaleej Times 12 Aug 2026 |
| ValuStrat Price Index | 219.2 points | −0.3% MoM / −1.6% YoY | Residential, Jan 2021 = 100 | ValuStrat, via Khaleej Times 12 Aug 2026 |
| Apartment values | ۱,۳۹۷ درهم امارات به ازای هر فوت مربع | −0.2% MoM / −4.2% YoY | Weighted average | ValuStrat, via Khaleej Times 12 Aug 2026 |
| Villa values | AED 2,039/sqft | −0.4% MoM / 0.0% YoY | Weighted average | ValuStrat, via Khaleej Times 12 Aug 2026 |
| Ready-home transactions | 3,546 | +11.4% MoM −26.4% YoY | Residential ready stock | ValuStrat, via Khaleej Times 12 Aug 2026 |
| Residential sales volume | — | +2% MoM −32% YoY | DLD transaction data | Betterhomes, reported 13 Aug 2026 |
| Total deal value | — | +3% MoM −49% YoY | DLD transaction data | Betterhomes, reported 13 Aug 2026 |
| Prime deals AED 15M+ | — | +22% MoM −46% YoY | Luxury segment | Betterhomes, reported 13 Aug 2026 |
| Apartments vs villas | — | Apartments +5% MoM; villas/townhouses −12% MoM | Sales volume | Betterhomes, reported 13 Aug 2026 |
| Rental enquiries | — | +21% YoY | Betterhomes enquiry data | Betterhomes, reported 13 Aug 2026 |
Sources retrieved 15 August 2026: ValuStrat Price Index July 2026 via Khaleej Times, 12 August 2026; Betterhomes analysis of Dubai Land Department data, reported by IndexBox 13 August 2026; Springfield Properties Dubai Real Estate Report via Zawya press release; Al Masdar Al Aqaari analysis of DLD data, 31 July 2026. Where two sources report a comparable metric differently, the scope column explains why. Figures are not additive across rows from different sources.
Where Prices Moved Most in July 2026
Annual price changes by community, from the ValuStrat July 2026 index as reported by Khaleej Times on 12 August 2026. The spread between the best and worst communities is far wider than the citywide average implies.
The sharpest annual apartment decline on the index. Prestige addresses with heavy investor ownership and thin end-user demand have corrected hardest through 2026.
Second-steepest apartment fall. Established beachfront stock competing against a large pipeline of newer waterfront product elsewhere in the city.
A mid-market community giving back ground, indicating the softness is not confined to the prime end of the apartment market.
The strongest performer on the index. Supply-constrained established villa communities have been the most resilient asset class through the 2026 adjustment.
Dubai’s ultra-prime villa address continued to appreciate while the apartment index fell 4.2% over the same period — a clear divergence by asset type.
The best-performing apartment community, ahead of Dubai Sports City at +5.4% and Al Quoz Fourth at +5%. Affordable, end-user-led districts outperformed prime.
Villa declines over the same period: Mudon −7.2% and Victory Heights −5.4% year-on-year. Source: ValuStrat July 2026 index via Khaleej Times, 12 August 2026.
Want this data applied to a specific property?
Citywide averages do not price a unit. Tell us the community and the budget — we will tell you what the July data means for that asset.
Reading July 2026 Properly
Three things the July numbers say that the headline percentages obscure.
The monthly and annual figures tell opposite stories — both are true
Month-on-month, almost everything improved: volumes up 2%, value up 3%, ready-home sales up 11.4%, prime deals up 22%. Year-on-year, almost everything fell: volumes down 32%, value down 49%, luxury down 46%. Both readings come from the same DLD records. The market is recovering from a spring correction against a 2025 baseline it has not regained.
Villas and apartments have decoupled
Over the year to July 2026 the villa index was flat while apartments fell 4.2%. Underneath that, Jumeirah Islands rose 15% and Burj Khalifa fell 19% — a 34-point spread inside one city in one month’s data. Betterhomes’ volume data cuts the other way, with apartment sales up 5% on the month while villas and townhouses fell 12%. Prices favoured villas; transaction activity favoured apartments.
Off-plan still carries the volume, ready stock carries the value
Off-plan accounted for roughly 70–73% of residential transactions depending on the source, but only 58.9% of residential value on Springfield’s count — and on Al Masdar’s all-segment DLD figures, ready homes produced AED 18.92 billion of value from 4,308 sales against AED 15.96 billion from 9,622 off-plan sales. Ready stock trades in far smaller numbers at far larger tickets.
How July Fits the 2026 Story So Far
To read July properly you need the shape of the year behind it. ValuStrat’s Q2 2026 review, reported by Khaleej Times on 21 July 2026, put the residential price index at 220 points for the quarter, a 4% quarter-on-quarter decline, with a cumulative fall of about 10% since late February. The monthly path through that period was roughly 6% in March, 2% in April, and 1% in each of May and June.
Against that sequence, July’s 0.3% is the flattest month of the correction so far. The same Q2 review recorded average villa values around AED 13 million, up 2% year-on-year, and average apartment values around AED 1.79 million, down 3% — the same villa-versus-apartment divergence that persisted into July.
The non-residential picture was materially stronger. ValuStrat’s Q2 review put the office price index at 299.5 points, a record high, up 3.7% quarter-on-quarter and 13.9% year-on-year, with an average transaction price of AED 2,045 per square foot, also a record — even as office sales volume fell more than 50%. Industrial and logistics capital values rose 8.4% quarter-on-quarter and 17.7% annually. Dubai’s commercial and industrial segments were not participating in the residential adjustment.
Supply is the variable to watch into the second half. The same review noted roughly 20,000 residential units completed in H1 2026, against a full-year pipeline target above 129,000 units. Whether that gap closes through the second half, and how much of it actually lands, will do more to shape prices into 2027 than any single month’s transaction count.
Where the activity was
Springfield Properties’ report identified Dubai South, Downtown Jebel Ali, دایرهٔ روستای جمیرا, Business Bay and Arjan as the leading communities by residential transaction volume in July, with land transactions accounting for around half of commercial value. Farooq Syed, the company’s chief executive, framed the month around the evolving definition of value among buyers. The list is notable for what is on it: the volume is in affordable and mid-market districts, not at the prime end — consistent with Dubai Silicon Oasis and Dubai Sports City leading the apartment price gains.
2026 Price Path — ValuStrat Index
Monthly residential value change
Beyond Residential — Q2 2026
Source: ValuStrat Q2 review, 21 Jul 2026
پرسشهای متداول
The most common questions about Dubai’s July 2026 property data.
Turn Market Data Into a Decision
A citywide index does not tell you what to pay for a specific unit in a specific tower. Our team works from live community-level data and will tell you plainly when the numbers do not support a purchase.

به بحث بپیوندید