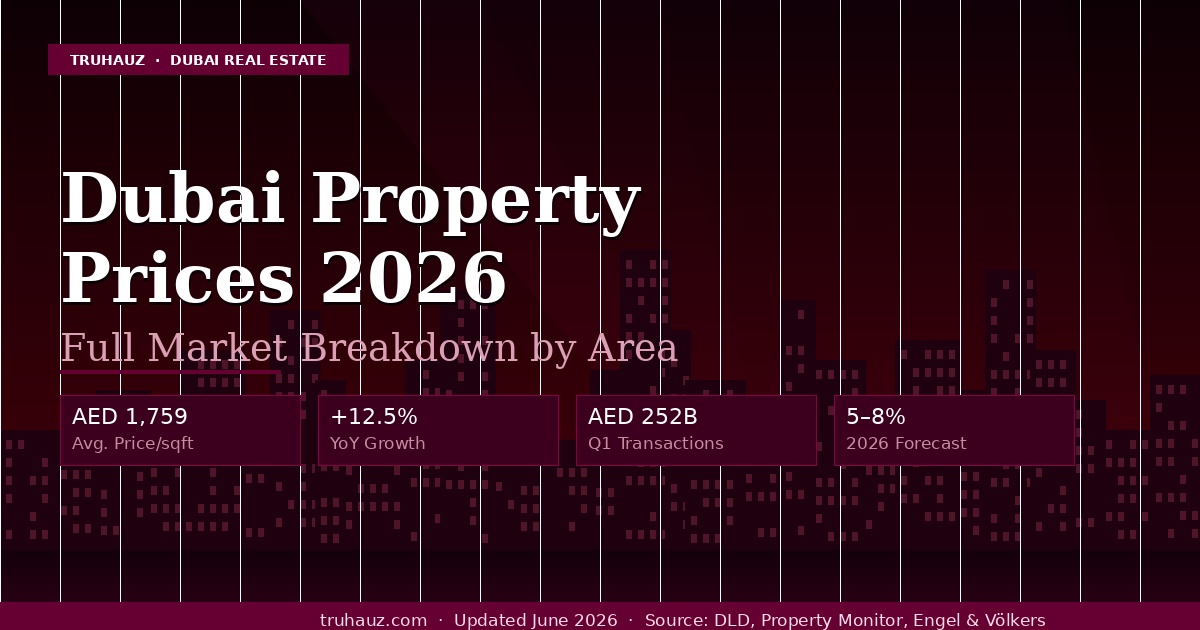
Dubai Real Estate
Market Data 2026
Verified transaction data, average prices per sqft, rental rates, yields, and market trends across all major Dubai communities — sourced from the Dubai Land Department and leading market research firms.
Dubai Property Prices per Square Foot — 2026
Average transaction prices per sqft across Dubai’s primary residential communities. Figures reflect Q1 2026 DLD-registered sales. Off-plan and ready prices shown separately where data is available.
Sources: Dubai Land Department (DLD), Property Monitor, Engel & Völkers, CBRE Q1 2026
| Community | نوع العقار | Avg. AED/sqft | YoY Change | Entry Price | Market Tier |
|---|---|---|---|---|---|
| تلال الإمارات | Villas | AED 14,500+ | +11% | AED 35M+ | Ultra Luxury |
| نخلة جميرا | Apartments & Villas | AED 3,500–4,000 | +14% | AED 2.5M+ | Luxury |
| وسط مدينة دبي | شقق | AED 2,800–3,200 | +13% | AED 1.8M+ | ممتاز |
| دبي مارينا | شقق | AED 2,400–2,800 | +11% | AED 1.2M+ | ممتاز |
| دبي هيلز استيت | Apartments & Villas | AED 2,100–2,600 | +12% | AED 1.3M+ | ممتاز |
| خليج الأعمال | شقق | AED 2,000–2,400 | +11% | AED 900K+ | Premium–Mid |
| خور دبي | شقق | AED 1,900–2,200 | +15% | AED 1.1M+ | Premium–Mid |
| جزر دبي | Apartments & Villas | AED 1,800–2,200 | +16% | AED 1.0M+ | Mid–Premium |
| Al Yelayiss / MBR City | Townhouses & Villas | AED 1,808 | +13% | AED 2.0M+ | Mid–Premium |
| قرية جميرا الدائرية (JVC) | شقق | AED 1,448–1,473 | +10% | AED 450K+ | Mid-Market |
| دبي الجنوب | Mixed | AED 1,400–1,700 | +16% | AED 550K+ | Mid-Market |
| Arjan / Dubailand | شقق | AED 1,100–1,400 | +9% | AED 500K+ | Mid-Market |
| Deira / Bur Dubai | شقق | AED 800–1,000 | +7% | AED 350K+ | Affordable |
| المدينة الدولية | شقق | AED 700–850 | +8% | AED 350K+ | Affordable |
| Dubai Market Average | All Types | AED 1,759 | +12.5% | — | الربع الأول 2026 |
Prices are averages of DLD-registered transactions. Individual units vary by floor, view, and finish. Data: Q1 2026.
Dubai Average Annual Rents by Area — 2026
Average annual rent in AED for apartments by bedroom type across Dubai’s major communities. Figures are market medians based on Ejari-registered leases and live listings.
Sources: DLD Rental Index (Ejari), Bayut, Property Finder, CBRE Q1 2026
وسط مدينة دبي
Burj Khalifa district · city centre
دبي مارينا
Waterfront · JBR adjacent
خليج الأعمال
Canal-facing · mixed use
قرية جميرا الدائرية
Mid-market · highest volume
دبي هيلز استيت
Suburban · golf community
نخلة جميرا
Luxury island · waterfront
Arabian Ranches
Villa community · suburban
Deira / Bur Dubai
Heritage districts · city core
المدينة الدولية
Most affordable freehold area
Gross Rental Yields by Area — Dubai 2026
Gross rental yield = annual rent ÷ purchase price × 100. Net yields (after service charges and operating costs) are typically 1.5–2.5% lower than gross. Dubai’s average gross yield of 7.1% compares favourably to London (3–4%), Singapore (2–3%), and New York (4–5%).
Sources: CBRE Q1 2026, Grovy Real Estate, Polaris Corporate Services, DLD Rental Index
| مساحة | نوع العقار | Gross Yield | Net Yield (est.) | Avg. Purchase Price | Avg. Annual Rent |
|---|---|---|---|---|---|
| المدينة الدولية | شقق | 9–10% | 7–8% | AED 450K | AED 40K–45K |
| Dubai Investments Park | شقق | 9–10.5% | 7–8.5% | AED 500K | AED 46K–52K |
| حدائق ديسكفري | شقق | 9–10% | 7–8% | AED 550K | AED 50K–55K |
| تاون سكوير | Apartments & TH | ٧–٩% | ٥.٥–٧% | AED 750K | AED 56K–68K |
| قرية جميرا الدائرية | شقق | ٧–٩% | 5.5–6.5% | AED 700K | AED 50K–63K |
| الفرجان | Apartments & Villas | 7–8.5% | ٥.٥–٧% | AED 900K | AED 65K–76K |
| دبي الجنوب | Mixed | ٦–٨% | 4.5–6% | AED 750K | AED 48K–60K |
| خليج الأعمال | شقق | 6.5–7.6% | 4.5–5.5% | AED 1.1M | AED 72K–84K |
| دبي مارينا | شقق | 5.5–6.8% | 4–5% | AED 1.4M | AED 78K–95K |
| دبي هيلز استيت | شقق | 5.4–6% | 3.8–4.5% | AED 1.5M | AED 82K–90K |
| وسط مدينة دبي | شقق | 5–6.2% | 3.5–4.5% | AED 2.0M | AED 100K–124K |
| نخلة جميرا | شقق | 4–5% | 2.8–3.8% | 3.5 مليون درهم إماراتي | AED 140K–175K |
| نخلة جميرا | Villas | 3.5–5% | 2.5–4% | AED 18M | AED 650K–900K |
| تلال الإمارات | Villas | 2.5–4% | 1.8–3% | AED 40M+ | AED 1M–1.6M |
| Dubai Average | شقق | 7.1% gross | 4.5–5% net | AED 1.1M | AED 78K |
Dubai Real Estate Transactions — Q1 2026
DLD-registered real estate transactions for Q1 2026. Total market value reached AED 252 billion — a 31% year-on-year increase. Volume reached 60,303 deals, up 6% on Q1 2025.
Source: Dubai Land Department (DLD) Official Q1 2026 Release
| Community | Q1 2026 Deals | Q1 2026 Value | Avg. Price/Deal |
|---|---|---|---|
| قرية جميرا الدائرية | 3,162 | AED 4.0B | AED 1.26M |
| دبي الجنوب | 2,889 | AED 5.4B | AED 1.87M |
| وادي الصفا 5 | 2,694 | AED 4.8B | AED 1.78M |
| خليج الأعمال | 1,778 | AED 4.3B | AED 2.42M |
| جزر دبي | 1,285 | AED 3.2B | AED 2.49M |
| خور دبي | 1,040 | AED 2.4B | AED 2.31M |
| وسط مدينة دبي | 557 | AED 2.8B | AED 5.03M |
| Total Dubai Market | 60,303 | AED 252B | AED 4.18M avg. |
Official DLD Data Access
The Dubai Land Department publishes real-time transaction data, the Residential Property Price Index (RPPI), and the official Rental Index through its open-data portal. For verified, official figures: dubailand.gov.ae/en/open-data — Rental Index: dubailand.gov.ae/en/eservices/rental-index
Off-Plan vs Ready Property Market — Dubai 2026
Dubai’s off-plan market has grown from 55% of transaction value in 2022 to 73–78% in 2026. The shift reflects investor preference for flexible payment plans, new supply from leading developers, and strong projected capital appreciation on handover.
Sources: Arabian Business, DXB Analytics, Betterhomes Q1 2026 Report
Market Share by Value — Q1 2026
Off-plan transactions as a share of total real estate transaction value
Off-Plan Market Share — Year by Year
The off-plan share of Dubai’s transaction value has grown consistently
Buying Off-Plan in 2026 — Key Facts
What buyers should know about the current off-plan market
Ready vs Off-Plan — Quick Comparison
Which is right for your investment strategy?
| Factor | Off-Plan | جاهز |
|---|---|---|
| Entry price | Lower (launch) | Market rate |
| Immediate income | None | From day one |
| Payment | Staged plan | Full at transfer |
| Mortgage | Limited options | Full mortgage |
| Capital upside | Higher potential | Moderate |
| Risk | Construction risk | Lower |
Quick Comparison — All Major Dubai Areas
At-a-glance comparison of price, yield, entry cost, and market activity across Dubai’s key residential communities.
Want personalised market data for your budget and goals?
TruHauz provides free investment consultations backed by live DLD data. Tell us what you’re looking for — we’ll find where the value is.
Find Your Dubai Property at the Right Price
Our team monitors live DLD data daily. Whether you’re buying, investing, or selling — we give you verified market intelligence, not guesswork.
truhauz.com · اشترِ · قيد الإنشاء · تأشيرة ذهبية · DLD Open Data